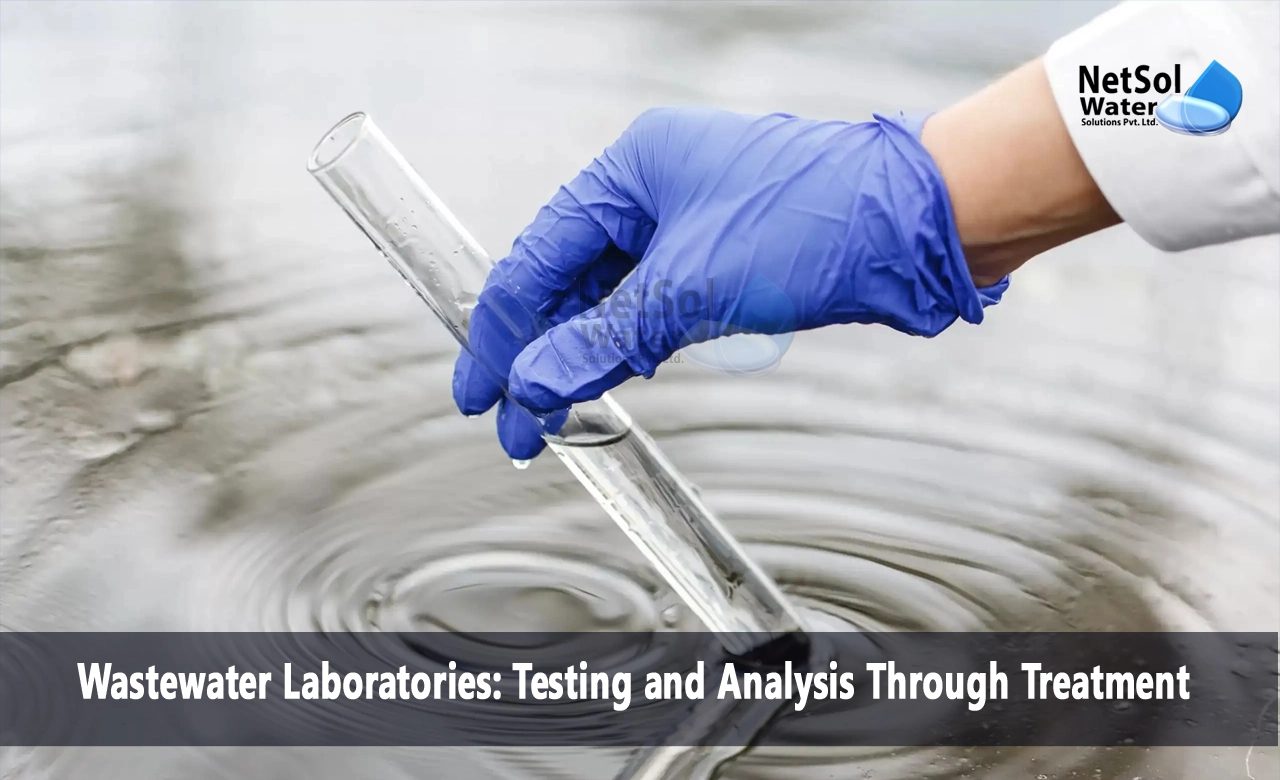
Wastewater Laboratories: Testing and Analysis Through Treatment
Wastewater treatment relies profoundly on what operators cannot see. Microscopic pathogens, trace pharmaceuticals and nutrient molecules drive unseen risks requiring mitigation before effluent discharge. Revealing this hidden water quality dimension depends on elaborate laboratory testing harnessing chemistry, biology and physics to expose contamination. Let’s explore these behind-the-scenes analytic activities integral to purification processes!
Sampling: Capturing Representative Trends
Effective monitoring begins with consistent sampling at strategic locations that best characterize influent flows, internal process stages and final effluents. Composite autosamplers blend aliquots into daily gallon batches reflecting temporal variations. Grab samples plucked specific moments help track acute spikes. Standard multiple point grid designs document spatial diversity across tank zones or from inlet to outlet flows. Consistent techniques and timing allows meaningful comparison of control charts mapping long-term pollution patterns. Careful collection best reflects reality inside dynamic systems.
General Testing: Universal Parameters
Basic water quality indicators track treatment efficacy and compliance. Turbidity gauges cloudiness revealing particulate levels. Electrical conductivity measures ionic strength correlating to dissolved salts and nutrients influencing biotic growth. Temperature and dissolved oxygen profiles help maintain optimal zones for microbial activity and solubility reactions during disinfection. Routine pH checks ensure proper chemical conditions. These quick, affordable field measures provide essential bioreactor health snapshots guiding immediate operations decisions.
Organics and Nutrients: Growth and Consumption
Carbon compounds like BOD (biochemical oxygen demand) reveal biodegradable organics digestible by activated sludge bacteria as respiration electron donors. Too much organic overload risks lowering dissolved oxygen failing conditions and hindering nitrification. Similar COD (chemical oxygen demand) measures monitor processing capacity left for organics oxidation by chlorine or ozone during disinfection. Tests for nitrogen species like TKN (total Kjeldahl nitrogen) and ammonia track nitrification progress converting wastes into nitrates then nitrogen gas stripped off by aeration. Phosphate and total phosphorus levels indicate biological nutrient removal controlling eutrophication potential.
Pathogens and Indicators: Signals of Contamination
Fecal coliform plate counts rapidly estimate overall pathogen contamination risks from raw sewage. Identification of specific threatening organisms like Giardia protozoan cysts requires specialized antigen detection assays or microscope examinations. More affordable substitutes like testing for Clostridium perfringens spores correlate well enough to wasting disease risks for routine monitoring needs rather than chasing every potential agent, much like tracking fecal itself as BOD markers. Process indicators help steer overall disinfection and exposure control strategies. Rapid enzymatic signals may soon supplement conventional methods for even quicker microbial screening.
Trace Contaminants: Emerging Concerns
Expanded chemical analyses now search for troubling anthropogenic micropollutants passing through standard treatment. Pharmaceuticals like antidepressants, antibiotics and hormonal therapies increasingly reach ecosystems via urine and flush water. Perfluorinated compounds from food packaging and clothing resist breakdown during processing. Combinatorial effects between synthetic ingredients and biological systems remain poorly studied as bottomless commercial innovation continually generates replacement compounds faster than individual bans or in-depth toxicological assessments. Advanced instrumental techniques like liquid and gas chromatography coupled with mass spectrometry help characterize such elusive microcontaminants missed by conventional methods.
Data Analysis: Translating Results into Action
Information itself cannot correct contamination — effective data handling can. Statistical process control charts track variability revealing performance departures from baselines. Structured inspection checklists standardize condition assessments. Geographic information systems map onsite issues or trace pollution origins. Maintaining organized records allows deeper pattern recognition and better communication of process adjustments needed to management. Database interfaces and automated analyzers make immense monitoring data digestible for timely, informed process control modifications improving treatment.
Down the Drain then Under the Microscope
Wastewater purification profoundly relies on revealing risks hidden within turbid influxes. Careful sampling, advanced analytics and diligent data management illuminate otherwise obscured contamination crucial for treatment. While rarely glimpsed by public beneficiaries, these meticulous laboratory efforts sustain modern sanitation and environmental quality by repeatedly testing the testable and steadily searching for the yet inscrutable.
Conclusion
Behind the physical constructions of wastewater infrastructure lies intense investigative efforts in scientific laboratories responsibly eliminating risks of downstream impacts from returned effluents. Careful contaminant monitoring and data handling drive dynamic treatment process control and adaptations answering ever-emerging pollution problems. Society owes great debt to dedicated analysts persistently parsing contamination pathways through clean water essential for human and ecological wellbeing.


