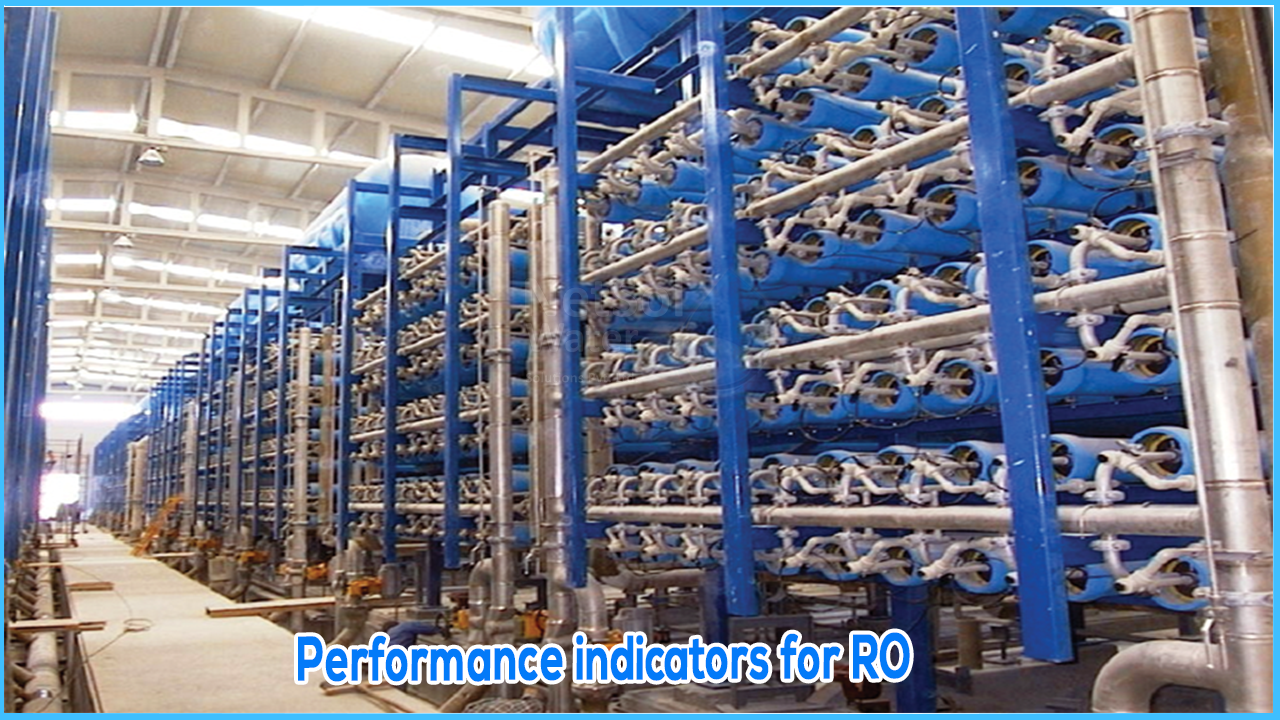
Performance indicators for ro
Reverse osmosis (RO) is a technology that removes a feedwater stream containing dissolved contaminants (salts and organics) into two flows: one of removed solids (concentrate or reject) and one of purified water, producing soft permeate water.Even as feedwater passes through the membrane, ions and organics are left in the reject, leaving the permeate with 96 to 98% fewer impurities. Because of the limited solubility of the dissolved salts left behind in the reject, permeate recoveries are typically limited to 75%.
The design and attention to pretreatment equipment is critical to the success of any reverse osmosis operation. Aside from multimedia filtration for the removal of suspended particles and colloidal, sodium regenerated ion exchange is used as a pretreatment for RO systems on occasion. These softener systems are sized to reduce scale on the RO membranes as a result of feedwater hardness. Replacing mechanical softeners with scale inhibitors is frequently more cost-effective and practical for the end user.
For most cases, installing a softener in a new RO installation is both unnecessary and expensive. With this information, it is possible to offer the end user significant ROI savings by turning off the ion exchange unit and replacing it with anti-scalant technology.
PARAMETERS TO MONITOR IN REVERSE OSMOSIS
Index of Silt Density (SDI)
The SDI is a measurement of the suspended particles and colloidal in the feedwater taken on-site. It is used to monitor the pre-treatment equipment's performance. SDI should be measured with pre and post multimedia filters, carbon filters, and post-cartridge filters. Pretreatment should be efficiently controlled using the designed flow rates and differential pressure limits for backwash of the equipment prior to the RO and cartridge filter replacement to achieve an SDI before using the membranes of less than 3.0. Filter aids can help reduce SDI prior to multimedia filtration, improving filter efficiency. Professionals, on the other hand, should exercise caution when using cationic filter aids.
Pressure drop in a reverse osmosis system
The difference in pressure between the inlet to the first membrane elements and the concentrate stream pressure coming off the last elements pushes water across the membrane surface of all the elements. This is referred to as the pressure drop or hydraulic differential pressure (P). As long as the flows and temperatures remain constant, the P will not change unless something physically prevents flow between the element's membrane envelopes (fouling). As a result, it is critical to monitor the pressure at each stage of the system.
Permeate flow has been normalised
In a RO system, normalised permeate flow is one of the most sensitive predictors of trouble. The permeate flow rate can be reduced by fouling. However, simply measuring the permeate flow rate is insufficient because it varies with feedwater temperature, pressure, permeate pressure, and conductivity (total dissolved solids, or TDS). Though all RO membrane manufacturers have their own equations for calculating normalised permeate flow, this complex calculation requires several parameters, including temperature, net driving pressure, pressure drop, permeate, feedwater TDS, and permeate flow.
Percentage of rejection
Percent rejection is used to monitor the permeate TDS. Because RO systems are used to remove dissolved salts, measuring salt (ion) rejection is a straightforward way to assess performance. The percentage of feedwater TDS removed in the permeate water is referred to as salt rejection.When RO membranes fail, the percent rejection decreases, and the permeate conductivity begins to rise. Certain foulants, on the other hand, can clog the membrane and raise the percent rejection reading. The permeate water conductivity of each pressure vessel should be measured on a regular basis, such as weekly or monthly, depending on the operation of the RO.
PDC monitoring
The majority of RO plant operations track data from reverse osmosis operations. This information is useful for forecasting the unit's performance. It is generally accepted as a best practise in the reverse osmosis industry for monitoring when to clean:
- The normalised permeate flow decreases by 10%.
- The passage of salt increases by 5 to 10%.
- The pressure drop increases by 10 to 15%.
- PDC rises by 10 to 15%.


